Quality Assurance: How to Test Speed Kit
Key Takeaways
- Comprehensive Toolkit: Speed Kit provides a full suite of debugging tools, including a browser extension, dashboard controls, URL parameters, a bookmarklet, and powerful console commands, enabling thorough testing across all browsers and devices.
- Isolate Test Sessions: Speed Kit offers multiple ways to test locally without affecting live users, from bypassing global deactivation with a console command to using separate browser profiles for clean A/B comparisons.
- In-Depth Diagnostics: Advanced browser developer tools allow you to inspect the live DOM, network requests, and console objects to get a precise understanding of how Speed Kit is optimizing your pages.
Introduction
While Speed Kit's Quality Assurance (QA) team rigorously tests every integration before it goes live, we empower our customers with a complete set of tools for their own validation, debugging, and ongoing testing. Understanding these tools is crucial for developers to verify functionality, for QA teams to confirm visual and functional correctness, and for project managers to observe the performance impact firsthand. This guide first outlines common testing scenarios and then provides a comprehensive overview of the available debugging utilities to ensure your Speed Kit integration is flawless.
Common Testing & QA Scenarios
This chapter outlines common workflows and best practices for testing your Speed Kit integration. The scenarios described here will reference various debugging utilities (like the browser extension, dashboard, and console commands). For a detailed explanation of each tool, please refer to the "Testing & Debugging Tools" section that follows this chapter.
To ensure a smooth and successful integration, follow these general best practices when testing Speed Kit.
- Test on Production: It is highly recommended to test on your production environment before a full rollout. While staging systems are supported, production often has unique configurations and traffic patterns that can reveal different behaviors.
- Test on Real Mobile Devices: For the most accurate view of the real-world user experience, always test on real, average mobile devices, not just desktop emulators.
- Use a Clean Browser Profile: When using developer tools for testing, it is best to use a clean or new browser profile. This prevents other browser extensions (like ad blockers) from interfering with page rendering or network activity, ensuring your test results are reliable and accurate.
Verifying a Correct Installation
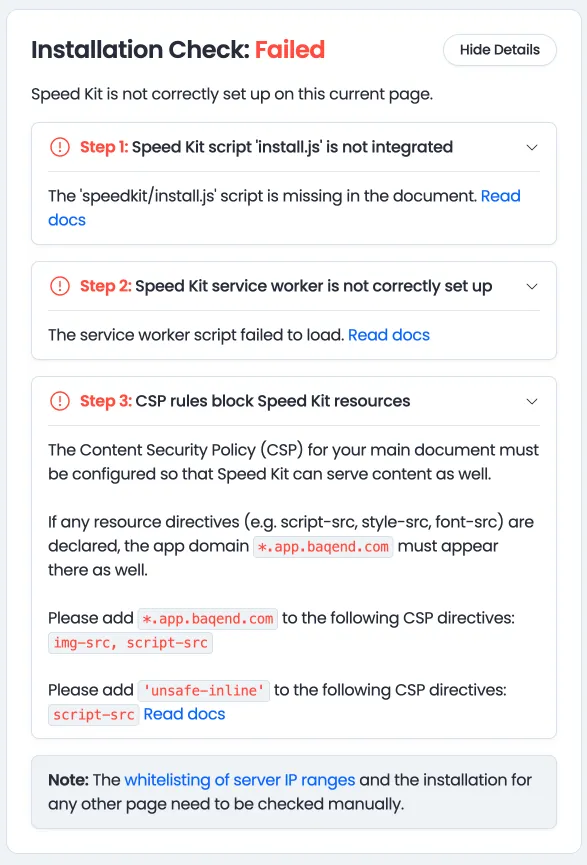
The easiest way to check the installation is with the Speed Kit browser extension. The "Status" tab in the extension provides an automated check that will identify any integration problems and offer a step-by-step guide to fix them.
Testing Speed Kit Locally
To test Speed Kit without impacting live users, the correct method depends on Speed Kit's global status.
Scenario 1: Speed Kit is Globally Disabled
If the service is turned off completely in the dashboard's "Settings" tab, it is inactive for all users. To test it in your local session, you must bypass this global deactivation.
- How to Test: Open the developer console and execute the command
SpeedKit.bypassDeactivation(true). This will activate Speed Kit only for your browser, allowing you to test its functionality safely while it remains off for everyone else.
Scenario 2: Speed Kit is Active at a 0% Split
This is a common setup where Speed Kit is active, but 100% of traffic is directed to the control group (the origin). This allows you to easily enable Speed Kit for your session to test.
How to Test:
- First, enable Speed Kit for your local session by using the bookmarklet or the
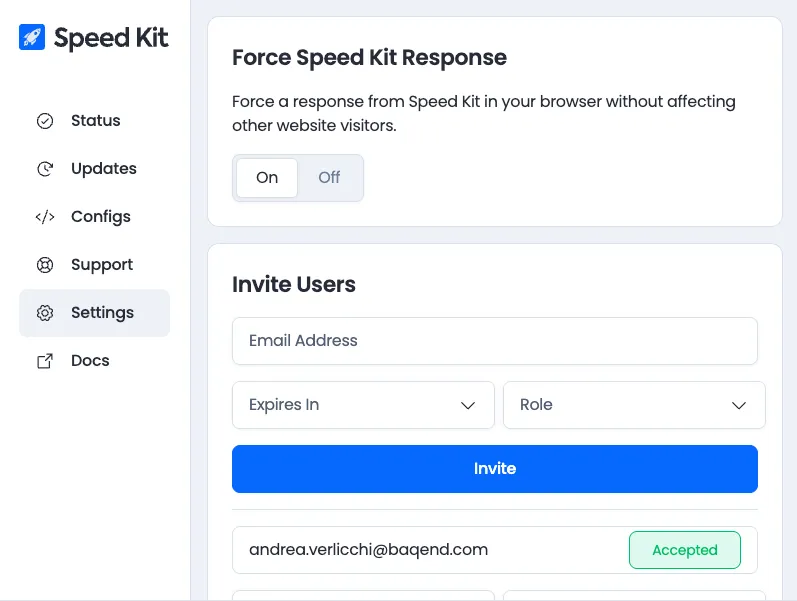
?enableSpeedKit=1URL parameter. - For the most stable testing experience, you can then use the "Force Speed Kit Response" toggle in the browser extension's "Settings" tab.
Comparing Performance (Reliable A/B Testing)
For the most effective visual and performance comparison, it is helpful to view the Speed Kit version and the origin version of your site side-by-side.
- Split-Screen Workflow: Arrange two browser windows next to each other in a split-screen view. This allows you to interact with both versions simultaneously and spot any differences in layout, functionality, or loading behavior.
- Isolating Test Groups with Chrome Profiles: The most reliable method to avoid any unwanted side effects is to use two separate Chrome profiles. Create one profile for the "A" group (Speed Kit enabled) and another for the "B" group (origin/control). This ensures each session is completely isolated. Use the bookmarklet or URL parameters to assign each profile to the correct group.
Testing a New Configuration in a Live Environment
Speed Kit allows you to safely test a new or updated configuration on the live site without activating it for all users.
1. Navigate to the "Configs" tab in the Speed Kit Dashboard.
2. Activate the new test configuration by toggling its switch to "on". This enables it only for browser sessions where it is explicitly activated via a special link.
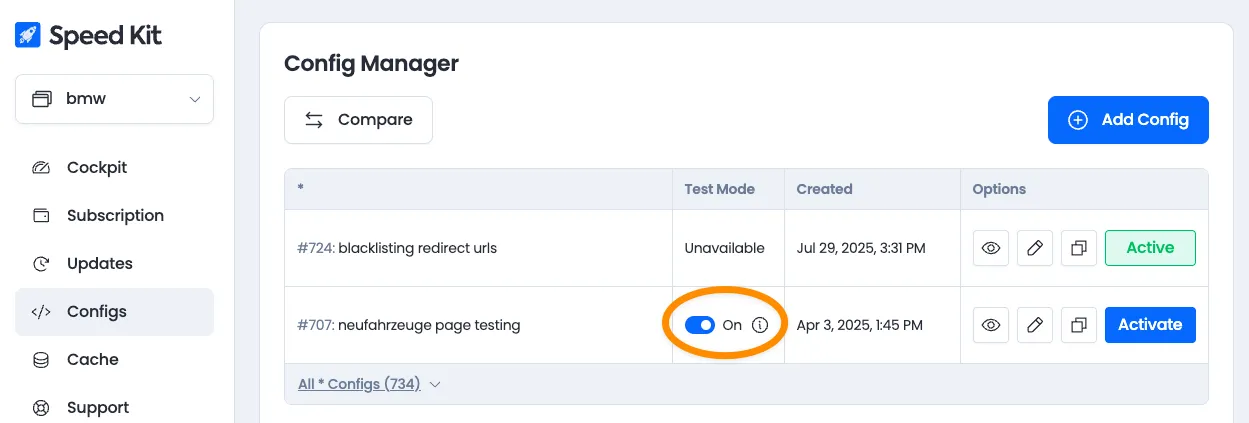
3. Click the info icon next to the toggle to get a unique link and QR code. Use this link to test the new configuration in your browser or on other devices.
4. Once you have validated that the new configuration works as expected, you can click the "Activate" button to roll it out to all users. The previous configuration will be archived, allowing you to roll back instantly if needed.
Testing & Debugging Tools
Speed Kit Browser Extension (Chromium)
For users of Chrome, Edge, and other Chromium-based browsers, our browser extension is the most powerful tool for local debugging. Note that some features, such as triggering content updates, require you to be signed in to your Speed Kit Dashboard account.
The extension icon provides an at-a-glance status indicator:


- Grey Rocket: Speed Kit is not active on this page.
- Blue Rocket: Speed Kit is active, but the current page was served from the origin.
- Blue Rocket with Green Dot: Success! The page was served by Speed Kit.
Status Tab
- Installation Check: Instantly verifies if Speed Kit is installed correctly. If any issues are found, it provides clear error messages and a step-by-step guide to resolve them.
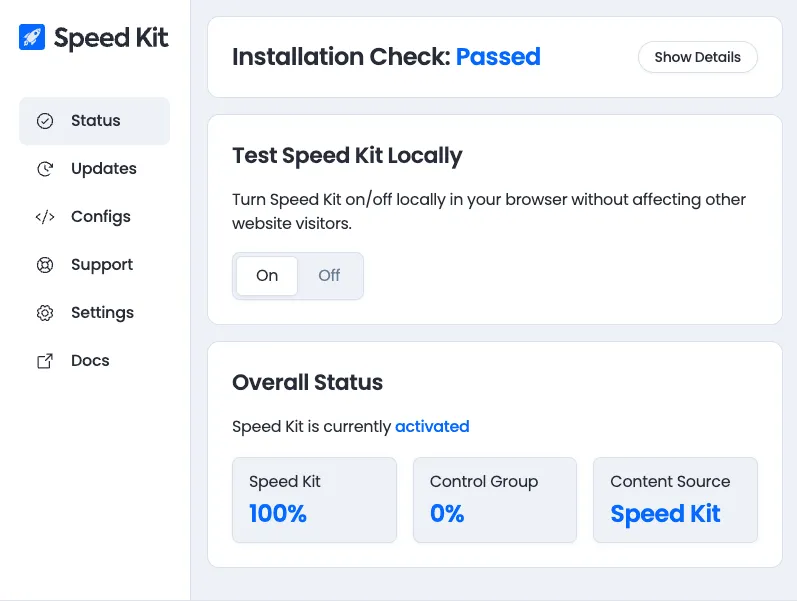
- Turn Speed Kit On/Off: This toggle activates or deactivates Speed Kit only for your local browser session. This is the ideal method for testing and A/B comparisons without affecting any other users.
- Overall Status: Indicates whether Speed Kit is globally activated for the website in the dashboard and shows the current A/B test traffic distribution (e.g., "Speed Kit 100% / Control Group 0%" means all traffic is being served by Speed Kit).
- Content Served: Shows whether the current page was delivered by Speed Kit or the origin server.
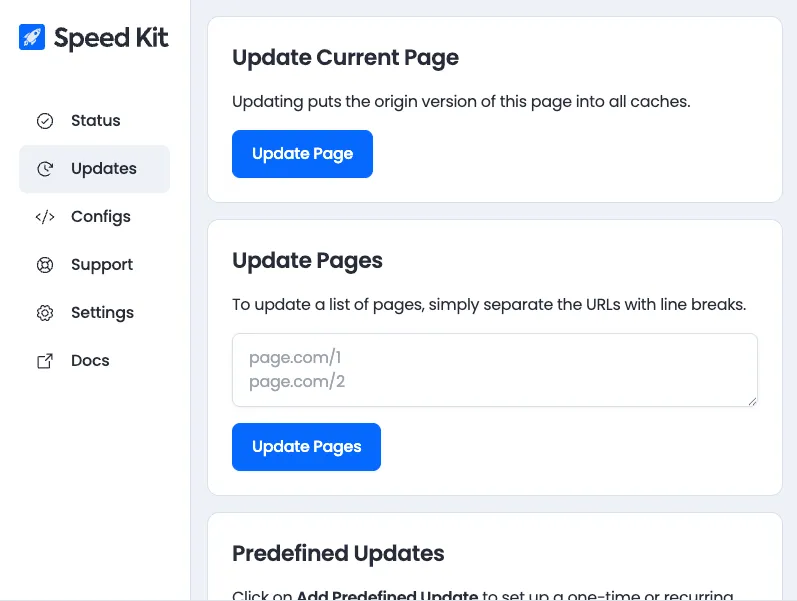
Updates Tab
Manually trigger a content refresh for the current page you are viewing. Note: This action requires you to be logged into the Speed Kit Dashboard.
Settings Tab
The "Force Speed Kit Response" toggle is the primary debug mode. When enabled, it forces every request in your local browser to be served by the Speed Kit infrastructure. This mode bypasses the real-time race against the origin and the safety passthrough period after a deployment. It is the recommended mode for reliably testing the Speed Kit version of a page.
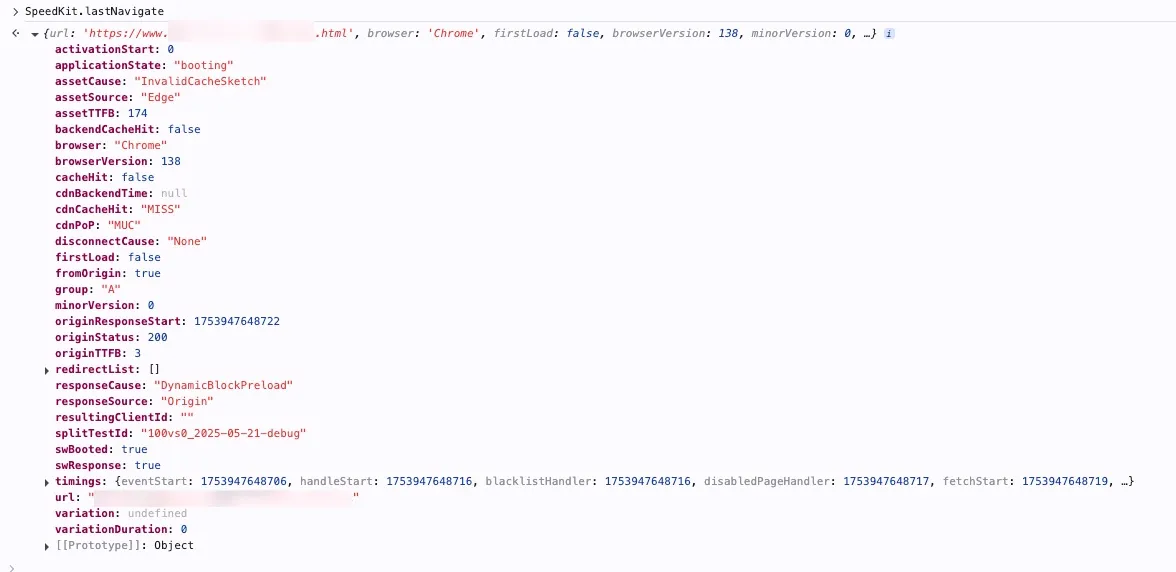
Note: In some rare scenarios, this function might fail to force a Speed Kit response. You can diagnose this by checking the SpeedKit.lastNavigate.responseCause property in the developer console. If this property shows an error code, a problem has occurred. Please get in touch with our support team for assistance in such cases.
Speed Kit Dashboard (All Browsers)
The Speed Kit Dashboard is your central hub for managing and monitoring the service. Several of its features are invaluable for debugging and configuration.
Settings Tab
The Settings tab provides high-level controls for managing Speed Kit's global state and for testing.
- Global Activation Switch: This is the master switch for the service. You can globally activate or deactivate Speed Kit for all users with a single click. This acts as a primary kill switch to revert all traffic to the origin if a critical issue is suspected, with the change taking effect globally within a few seconds.
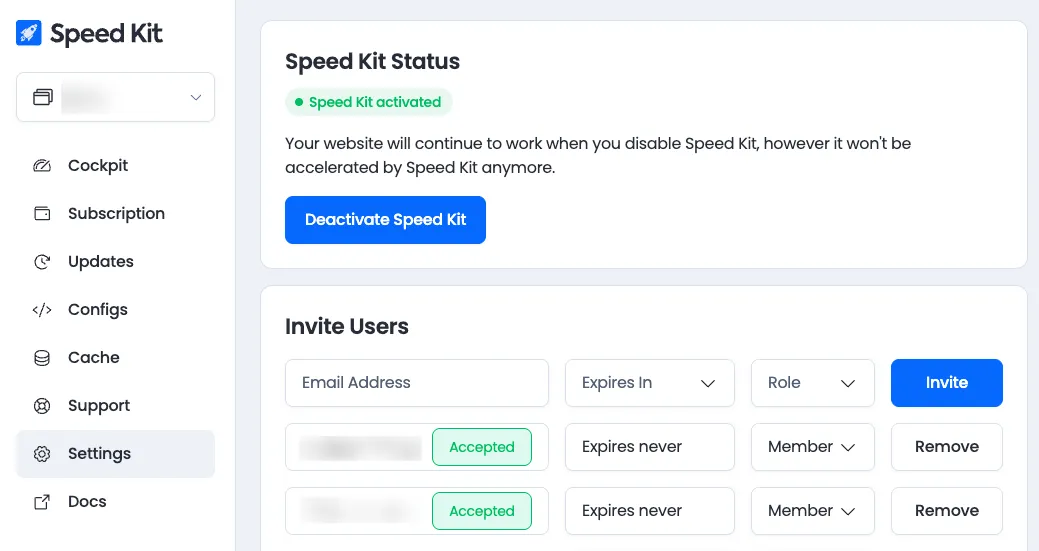
- Force Speed Kit Response: This feature generates special links that force a response from Speed Kit's infrastructure. By clicking the button, you create links for your origins that can be used to test the active Speed Kit configuration in any browser or on any device. This is ideal for quick validation on mobile devices or in browsers where the extension is not available.

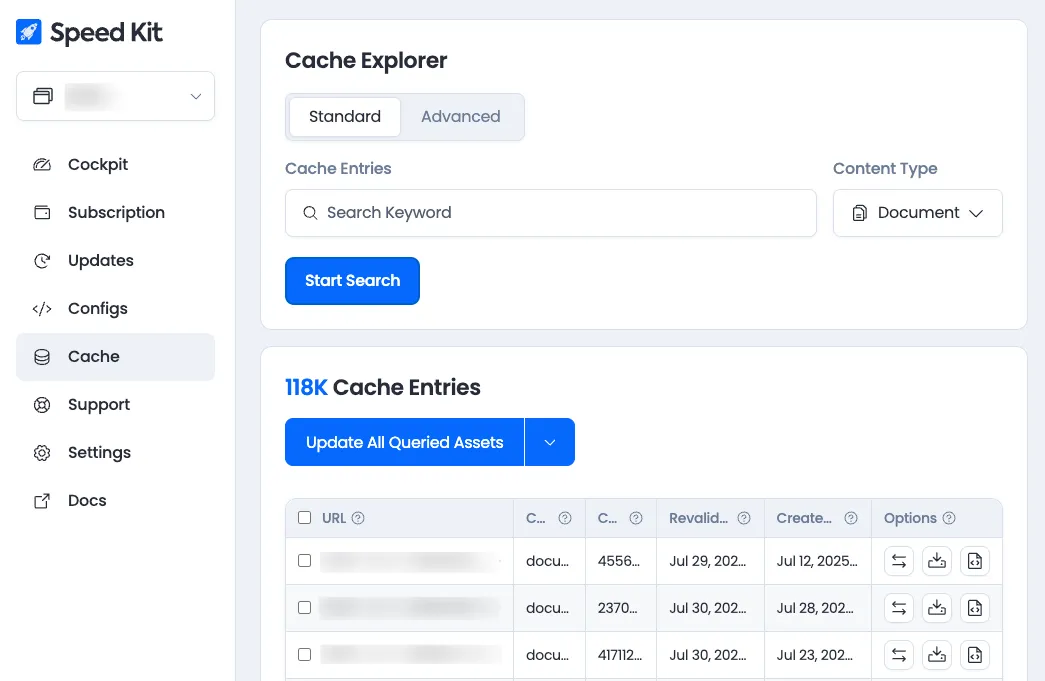
Cache Tab
Use the powerful Cache Explorer to view all files currently stored in Speed Kit's caches. You can filter this list to find specific resources. To verify if a page is cached, you can find its unique cache key in the page's HTML source: <meta name="baqend:asset_url" content="URL">. This key represents the URL with non-essential query parameters stripped and can be used to look up the asset in the explorer.
Updates Tab
This tab provides tools to manage and monitor content freshness.
- Manual Updates: You can manually trigger a content revalidation job for a single page or a list of URLs. This is essential for testing if recent content changes are being picked up correctly.
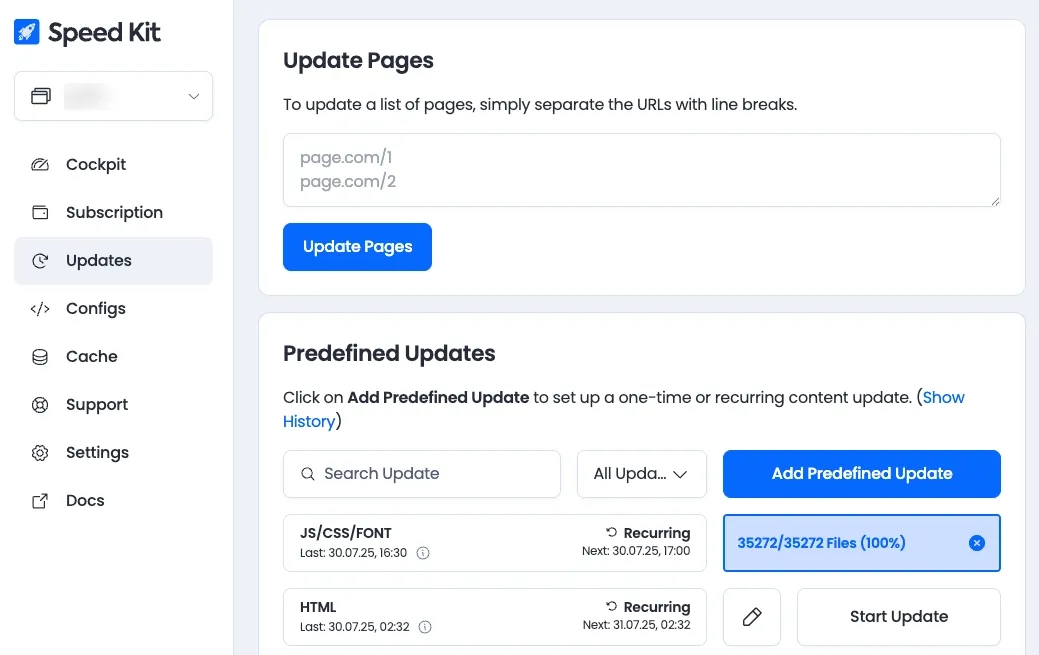
- Scheduled Updates: The schedules for all automatic periodic update jobs can be viewed and configured here.
- Monitoring Job Status: The dashboard includes an advanced view to monitor the status of all running jobs, including those initiated by our automatic systems. This is particularly useful for checking if a deployment is currently in progress and estimating its duration. Monitoring deployments is important for debugging, as a running deployment can temporarily prevent Speed Kit from serving a cached response.
Configs Tab
This powerful section allows for the detailed management of all Speed Kit rules and settings.
- Managing Configurations: View a list of all available configurations, including the currently active one and any test configurations.
- Editing Rules: Here you can adjust critical settings like the blacklist, which excludes specific pages or entire sections of your site from being accelerated by Speed Kit.
- Activating Configurations: Once a test configuration has been validated, you can roll it out to all users from this tab.
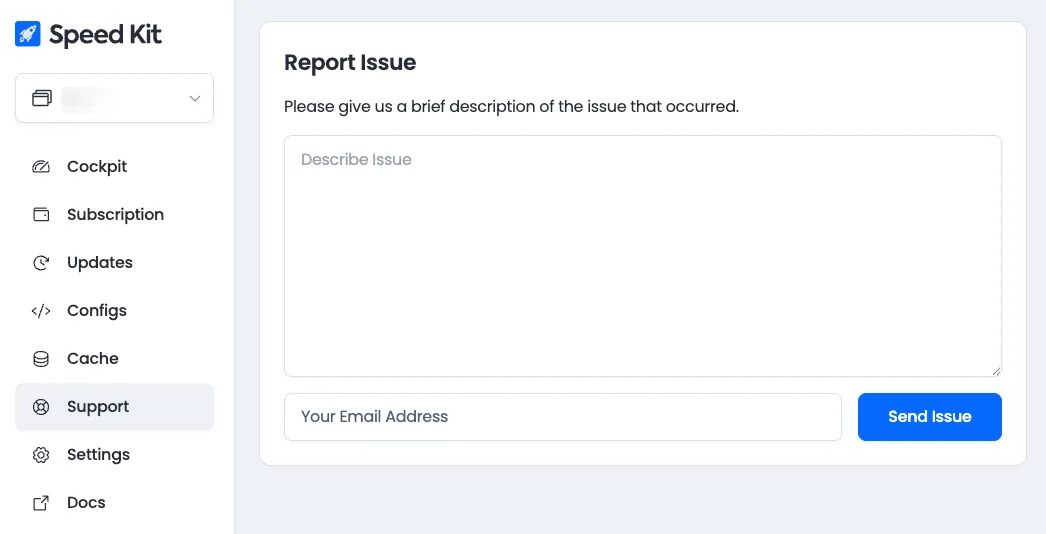
Support Form
The easiest way to ask for help is via our integrated support form, ensuring our team gets all the context they need to assist you.
Developer Tools (Chromium)
For deep technical analysis, the browser's built-in developer tools are indispensable for users of Chrome, Edge, and other Chromium-based browsers.
Elements Tab
The Elements tab provides a live view of the rendered DOM and is one of the quickest ways to verify if Speed Kit is active on a page.
- Inspect the
<html>Tag: Check the<html>tag at the top of the DOM tree. If the page was delivered by Speed Kit, it will initially have the classspeed-kit-dynamic-loading. If the page was also prerendered, you will seespeed-kit-pre-rendered. - Verify the Merge: After the live content from the origin has been merged, the
speed-kit-dynamic-loadingclass is replaced withspeed-kit-dynamic-loaded. Seeing this final class confirms that the entire Speed Kit process has been completed successfully.

- Cache Key: A meta tag,
<meta name="baqend:asset_url" content="URL">, is added to the<head>. This contains the normalized URL used as the key in our cache. - JavaScript Handling: To prevent issues with personalized or dynamic scripts, all inline JavaScript is removed from the initial HTML and executed later from the origin version. All script tags are moved to the end of the
<body>and their execution is blocked by a synchronous script (speed-kit-dom-ready.js) until the content merge is complete. - Dynamic Fetcher: An inline script is added to manage the content merge process.
Application Tab
Navigate to the "Application" tab and select "Service Workers". Checking the "Bypass for network" box will instantly disable Speed Kit for that tab. Unchecking it will re-enable it. This method is the quickest way to switch between the Speed Kit and origin experiences, as it doesn't require the service worker to be fully reinstalled or uninstalled.

- What it does: This option tells the browser to completely ignore the service worker for that tab. All requests will go directly to the network, as if Speed Kit were not installed. This is ideal for quickly comparing the Speed Kit version against the original site without having to fully uninstall the service worker.
- Cache Behavior: This method specifically bypasses the Speed Kit service worker and its cache. It does not automatically clear the standard browser HTTP cache (for images, CSS, etc.). To bypass both the service worker and the browser's HTTP cache, you must perform a hard reload (e.g.,
Cmd+Shift+Ron Mac orCtrl+F5on Windows) or disable the browser cache in the Developer Tools. - Pro-Tip for Comparison: For the cleanest and most reliable A/B comparison, use two different browsers (or a regular and an incognito window). Keep Speed Kit enabled in one and disabled in the other (e.g., using the
?disableSpeedKit=1URL parameter or the bookmarklet). This allows for a true side-by-side view without altering cache states between reloads.
Network Tab
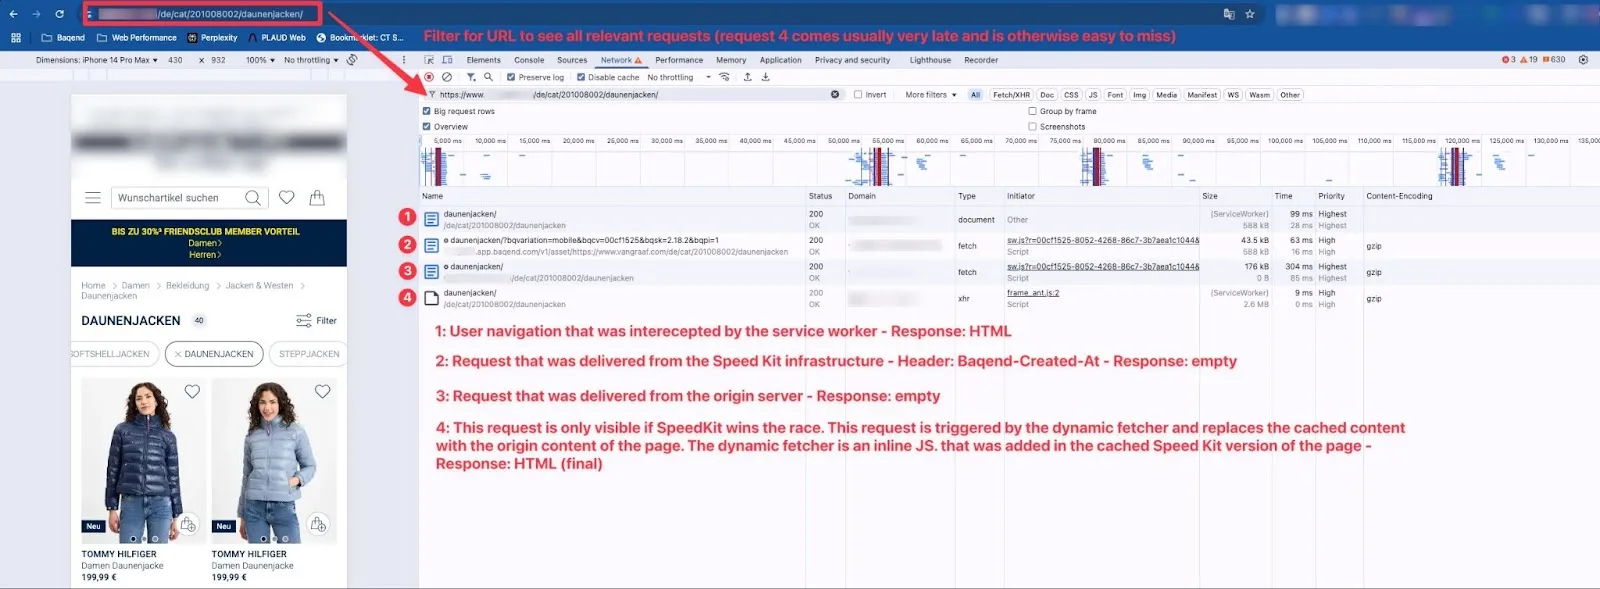
By inspecting the network requests for a page, you can verify how Speed Kit delivered the content. There are two key indicators for service worker activity in the network panel:
- Cog Icon (⚙️): This icon next to a request indicates that the service worker initiated this network request.
- Size Column: If a request was fulfilled directly from the service worker's cache without a network call, the Size column will show (
from service worker).
The following numbered list describes the typical network requests you will see when Speed Kit is active, corresponding to the requests labeled in the screenshot.
- User Navigation (Intercepted): This is the initial document request that was intercepted by the service worker. Its "Response" tab in DevTools shows the actual HTML payload from the winner of the race. If this response contains a
Baqend-Created-Atheader, it confirms that Speed Kit won. - Speed Kit Infrastructure Request (optional): This request to the Speed Kit infrastructure only appears if the content cannot be served from a local cache (prerendered or service worker). It is used to fetch the anonymized, cached version of the page from the network (e.g., an edge node).
- Origin Server Request: This is the parallel network request made to your origin server during the race. Its response always contains the live, personalized HTML. The action taken with this response depends on the outcome of the race:
- If Speed Kit wins: The response is used to merge dynamic and personalized content into the page.
- If the Origin wins: The response is shown directly to the user, and no merge process is necessary.
- Dynamic Merge Process (optional): When Speed Kit serves a cached page, it injects an inline JavaScript at the end of the body called the dynamic fetcher. This entry in the network tab represents the work of that script. When Speed Kit wins the race, the dynamic fetcher uses the response from the 'Origin Server Request' (#3) to merge dynamic and personalized content into the page, ensuring the user always sees the correct version.
Source Tab: Debugging the Merge Process with Breakpoints
This advanced technique allows developers to pause the page rendering at critical moments to inspect the state of the DOM. It is particularly useful for debugging visual glitches or understanding exactly how content is being updated.
Key Breakpoint Locations
- Before the Merge: Set a breakpoint at the very beginning of the inline "dynamic fetcher" script. When the page pauses here, you will see the page exactly as it was served from the Speed Kit cache, before any live content has been merged.
- After the Merge, Before JavaScript Execution: Set a breakpoint inside the
speed-kit-dom-ready.jsscript. Pausing here allows you to inspect the final, merged DOM structure before it is potentially modified by your application's own scripts.
How to Set a Breakpoint
- Open the Developer Tools and navigate to the Sources tab.
- Find the main HTML document or the
speed-kit-dom-ready.jsfile in the file navigator. - Click on the line number where you want to pause to set a breakpoint.
- Reload the page. The browser will pause execution at your breakpoint.
Console (All Browsers)
The following JavaScript objects are available for advanced debugging in the developer console of any modern browser (including Chrome, Edge, Opera, Firefox, and Safari).
SpeedKit.lastNavigate: Provides detailed information about the last navigation. This includes theresponseCause, which explains why a certain response was served. For security reasons, the specific meaning of error codes within this property is not publicly documented. If you encounter an error code, please contact our support team for assistance. Other useful properties include whether the page was prerendered (activateStart: 1) and why an asset was revalidated (e.g.,assetCause: UrlCacheSketch).
SpeedKit.getTrackedData(): Shows all data collected by the Speed Kit RUM tool for the current session.
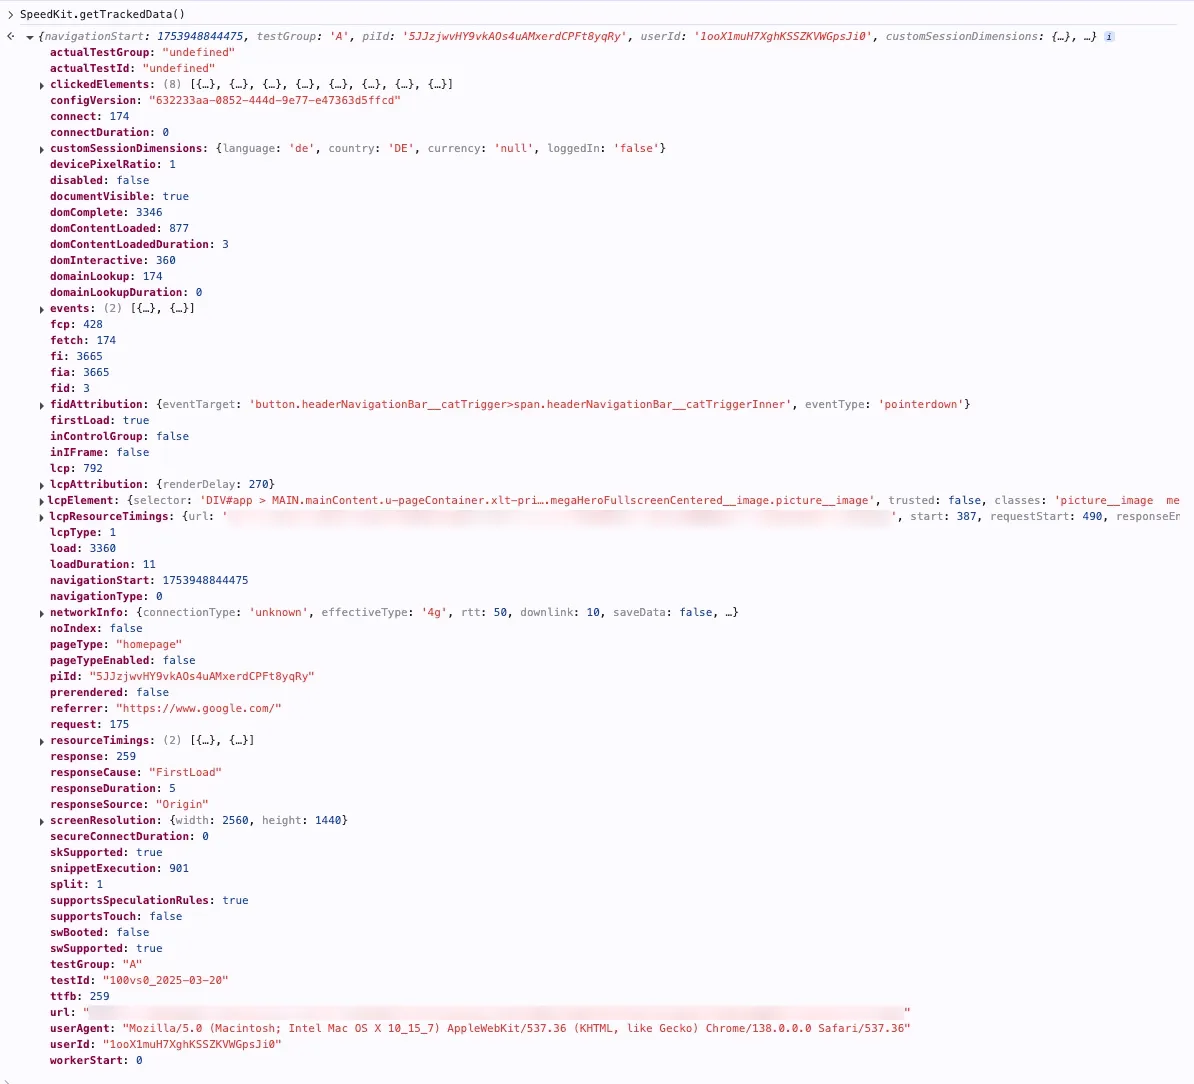
speedKit: Displays the full Speed Kit configuration object.

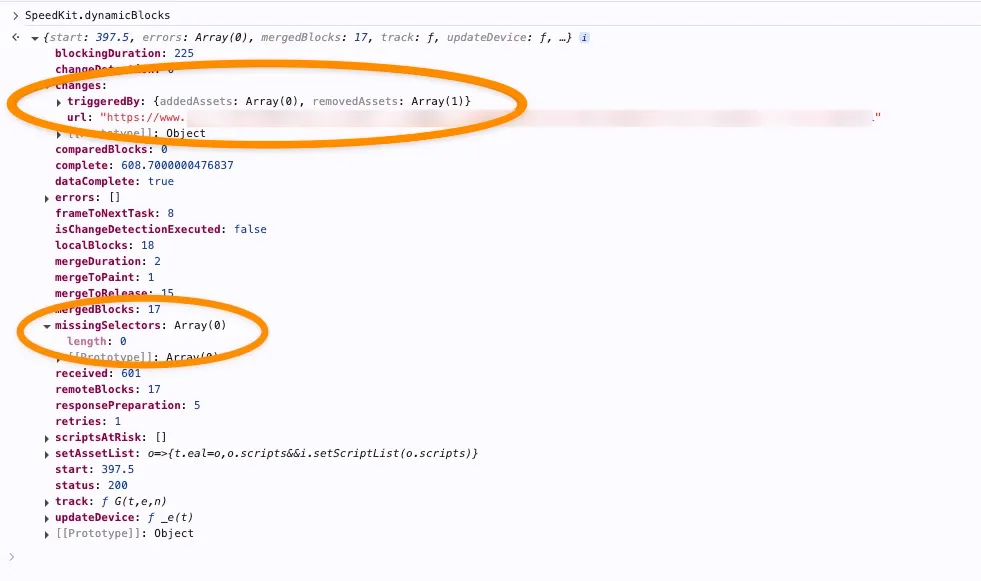
SpeedKit.dynamicBlocks: Shows information about the content merge process. The changes section lists any elements that were different between the cached and origin versions, which is useful for debugging change detection.
URL Parameters (All Browsers)
URL parameters provide a simple way to control Speed Kit's behavior directly in the browser's address bar, which is especially useful in scenarios where the browser extension is not available, for example, on mobile devices.
?disableSpeedKit=1: Add to any URL to disable Speed Kit in your browser.?enableSpeedKit=1: Use this to re-enable it.
Speed Kit Bookmarklet (All Browsers)
Installation
1. Open your browser and navigate to https://scripts.baqend.com/bookmarklet/.

2. Copy the code snippet provided on the page.
3. Create a new bookmark in your browser.

4. Edit the bookmark and paste the copied code into the URL or address field.
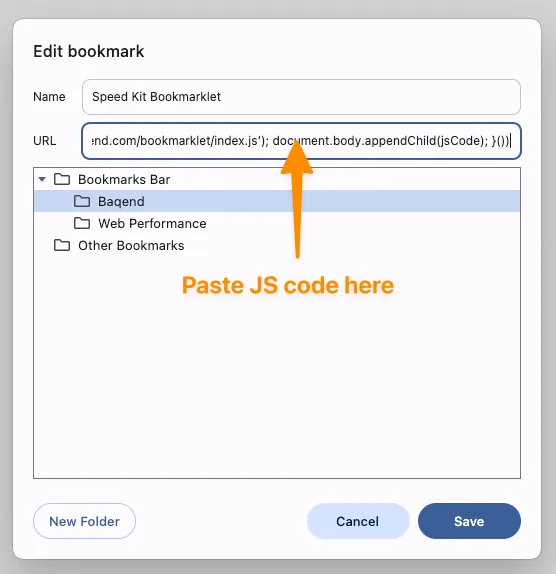
5. Save the bookmark.
Pro-Tip for Developers: Instead of creating a bookmark, you can copy the script and paste it directly into your browser's developer console. Executing the script will immediately trigger the same pop-up.
Usage
- Navigate to the website where Speed Kit is installed.
- Click the Speed Kit bookmarklet or run the script in the console.
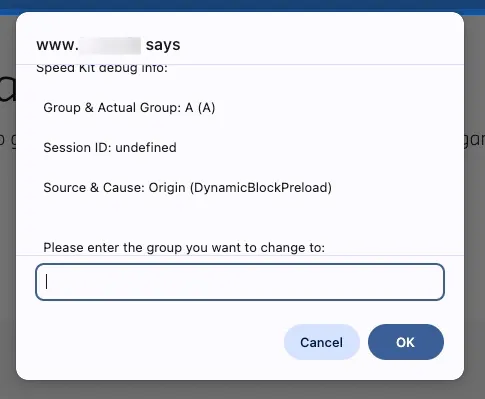
- A popup will appear, displaying the current status and debug information, such as the
responseCause. This is particularly useful for quickly checking Speed Kit's behavior on mobile devices. - To change the A/B test group, you can then enter a new value:
- Enable Speed Kit: Type "A", click "OK", and then reload the page.
- Disable Speed Kit: Type "B", click "OK", and then reload the page.
Automated Performance Testing with WebPageTest
WebPageTest is a powerful tool for synthetic performance testing. To accurately measure the uplift from Speed Kit, a multi-step test must be configured. This simulates a user's second page view, which is necessary to see the impact of Speed Kit's service worker and caching mechanisms.
Our self-hosted WebPageTest instance is available at:
Step 1: Initial Configuration
- Navigate to
https://wpt.baqend.com/and open the Advanced Configuration section. - Set the Test Location (e.g., a German location for German websites) and Browser (e.g., Chrome for Desktop, iPhone X for Mobile).
- In the Test Settings tab, select an appropriate Connection speed (e.g.,
FIOS NLfor Desktop,LTEfor Mobile).
Step 2: Advanced Settings
- In the Advanced tab, check the "Preserve original User Agent string" box.
- In the Chromium tab, select "I still don’t care about cookies" from the "Enable Extension" dropdown. This helps eliminate cookie banners from the test's screenshots and video.
- (Optional) For localized testing, you can add a command like
--accept-lang=dein the "Command-line" options under the Chromium tab.
Step 3: Scripting the Test
Navigate to the Script tab and paste one of the following scripts. These scripts first visit a page to install the Speed Kit service worker, and then navigate to the page you actually want to measure.
Testing a Standard Page Load
Use this script to measure a standard navigation to a specific page as a repeat visitor.
Speed Kit Enabled Run:
logData	0
navigate      >>URL of Home<<?enableSpeedKit=1
// Optional: Hides the first navigation step in the video
execAndWait   document.body.style = "all: initial; background-color: #DE640D; opacity: 0"
logData	1
execAndWait   document.body.style.backgroundColor="#fff"; location.href = '>>URL you would like to test<<'
Speed Kit Disabled Run:
logData	0
navigate      >>URL of Home<<?disableSpeedKit=1
// Optional: Hides the first navigation step in the video
execAndWait   document.body.style = "all: initial; background-color: #DE640D; opacity: 0"
logData	1
execAndWait   document.body.style.backgroundColor="#fff"; location.href = '>>URL you would like to test<<'
Replace >>URL of Home<< and >>URL you would like to test<< with your actual URLs.
Testing a Soft Navigation
Use this script to measure a soft navigation (a click within a Single-Page Application).
Script Template:
logData	0
navigate      >>URL from which the navigation should start<<?enableSpeedKit=1
// Optional: Hides the first navigation step in the video
execAndWait   document.body.style = "all: initial; background-color: #DE640D; opacity: 0"
logData	1
execAndWait   document.body.style = ""; >>Your Click Statement<<
To get the >>Your Click Statement<<, you must find a unique selector for the link on the page. You can test this in your browser's console, for example:
document.querySelector('a[href=">>URL of Click Target<<"]').click().
Step 4: Running the Test and Comparing Results
- Click Start Test to run your scripted test.
- On the results page, the relevant data will be in the final step (the one logged after
logData 1). - To create a side-by-side comparison video, run the test for both the enabled and disabled scripts. Then, go to the filmstrip view of one test, copy its test ID from the URL, and append it with a comma to the comparison URL of the other test.
