How to Measure Web Performance
Key Takeaways
- Prioritize Field Data (RUM): While lab data is useful for debugging, Real User Monitoring (RUM) provides the most accurate picture of true user experience by capturing performance across all devices, networks, and locations. This data is essential for making informed business decisions.
- Focus on User-Centric Metrics: Modern web performance revolves around Google's Core Web Vitals—Largest Contentful Paint (LCP), Interaction to Next Paint (INP), and Cumulative Layout Shift (CLS)—as they measure the actual user experience of loading, interactivity, and visual stability.
- Connect Performance to Business KPIs: The ultimate goal of measurement is to drive business success. Use RUM data to correlate performance metrics with key business indicators like conversion rates, bounce rates, and average order value to understand the financial impact of speed and justify optimization efforts.
Introduction
In the competitive world of e-commerce, website performance is not just a technical detail—it is a critical driver of business success. A fast, responsive, and stable website directly impacts user satisfaction, search engine rankings, and ultimately, your bottom line. However, to effectively improve performance, you must first be able to accurately measure it. This guide provides a comprehensive overview of web performance measurement, designed for both technical and business stakeholders in e-commerce.
Understanding how to measure performance involves distinguishing between two fundamental types of data: lab data from controlled, synthetic tests and field data (also known as Real User Monitoring or RUM) collected from your actual users.
We will explore the essential metrics you should be tracking, with a deep dive into Google's Core Web Vitals, which have become the industry standard for user-centric measurement.
Finally, we will outline a strategic framework for using this data to set meaningful goals, prevent regressions, and build a culture of performance that drives tangible business value.
Lab Data vs. Field Data: Understanding Your Tools
To build an effective performance strategy, it's crucial to understand the two primary types of data at your disposal: lab data and field data. They answer different questions and are both vital for a comprehensive measurement plan. A common and costly mistake is relying solely on your own experience; a site that feels fast on a developer's high-end laptop is often frustratingly slow for an average user on an older mobile device with a spotty connection.
Lab Data (Synthetic Monitoring)
Lab data is collected in a controlled, simulated environment. Tools like Google PageSpeed Insights, Google Lighthouse, or WebPageTest load your website on a predefined device with a consistent network speed, creating reproducible results.
Key Characteristics
- Reproducible & Consistent: Because the environment is fixed, you can run tests repeatedly and get very similar results, making it perfect for comparing changes over time.
- Immediate Feedback: You can run tests on demand and get results quickly, which is ideal for debugging and iterative development.
- Rich Diagnostics: Lab tools offer detailed information, such as waterfall charts and precise request timings, that are invaluable for pinpointing the root cause of a specific bottleneck.
- Ideal for Pre-Production: It's the best way to assess the performance impact of new features before they are deployed to your live site and to integrate performance checks into your CI/CD pipeline.
When to Use Lab Data
- Debugging: To isolate and fix a known performance issue in a controlled setting.
- Regression Testing: To automatically check if a new code change has negatively impacted performance before it goes live.
- Validating Fixes: To confirm that an optimization has had the intended technical effect (e.g., reduced bundle size).
Field Data (Real User Monitoring - RUM)
Field data, or RUM, is performance information collected directly from the real users visiting your website. It captures the true, unfiltered user experience across the entire spectrum of devices, network conditions, browser versions, and geographic locations.
Key Characteristics
- Authentic User Experience: It is the source of truth for how your website actually performs for your audience.
- Reflects Real-World Variability: It accounts for all the unpredictable variables that lab tests cannot, such as network fluctuations, device throttling due to low battery, or concurrent background tasks.
- Drives SEO: Google's Core Web Vitals, a direct ranking signal, are measured using field data from the Chrome User Experience Report (CrUX).
- Correlates to Business Impact: RUM is the only way to directly connect performance metrics to business KPIs, such as conversion rates and user engagement.
When to Use Field Data
- Understanding True User Experience: To see the performance your actual customers are getting.
- Monitoring Core Web Vitals for SEO: To track the metrics that directly influence your Google search ranking.
- Prioritizing Optimizations: To identify which issues are impacting the largest or most valuable segments of your user base.
- Setting Realistic Goals: To establish performance targets based on how speed impacts your specific business outcomes.
Understanding the Chrome User Experience Report (CrUX)
A critical source of field data is the Chrome User Experience Report (CrUX), which powers the Core Web Vitals assessments in tools like Google Search Console. It is essential to understand that CrUX data is collected exclusively from real Chrome browser users who have opted into syncing their browsing history and have usage statistic reporting enabled. This means the data represents only a subset of your total user base and does not include users on other browsers like Safari or Firefox. This is a key reason why a dedicated RUM solution, which captures data from all browsers, provides a more complete picture of your actual user performance.
Why a Dedicated RUM Solution is Recommended
While Google's free tools are an excellent entry point, a dedicated Real User Monitoring (RUM) solution offers significant advantages for comprehensive performance optimization.
- Real-Time Data & Immediate Insights: Get proactive alerts when performance degrades, allowing for rapid response.
- Granular User Segmentation & Drill-Down: Segment performance data by location, device, browser, network, or custom business tags to find where issues are occurring.
- Comprehensive Browser Coverage: Unlike CrUX (Chrome-only), RUM solutions collect data from all browsers your users employ.
- Correlation with Business Metrics: Directly link performance metrics to business outcomes like conversion rates and revenue.
- Deeper Diagnostics and Debugging: Gain richer context for performance issues, including error tracking integration.
- Data Ownership and Flexibility: You own the collected data and have full control over how it is analyzed.
The Proactive Advantage of Real-Time RUM
The primary limitation of free tools is their reliance on CrUX data, which is aggregated over a 28-day rolling period. This significant delay means that by the time a performance problem appears in your Google Search Console, it has already been negatively affecting your users—and potentially your SEO ranking—for weeks.
A real-time RUM solution is the only way to get ahead of this lag. Speed Kit's architecture includes an integrated Real User Monitoring system that acts as an early warning system, capturing performance data as it happens. This core capability allows our system to react to changes, but it also provides a rich data source for deeper analysis.
For customers who want to harness this powerful, real-time data, we offer dedicated dashboard access as an optional add-on service. This gives you a competitive advantage by providing an authentic, live picture of how users genuinely experience your site. You can segment performance data and correlate it directly with your business KPIs to make data-driven decisions long before lagging indicators would show a problem. To learn more about this service, please refer to our Speed Kit RUM Documentation.
What to Measure: Key Performance Metrics
While there are many metrics you can track, modern web performance focuses on a few key indicators that best represent the user's perceptual journey. Speed Kit is engineered to deliver significant improvements across these critical metrics, from server response times to visual stability. To understand the specific impact Speed Kit has on each of these metrics, please see our documentation: Speed Kit's Impact on Web Performance Metrics. These key indicators can be broken down into foundational metrics and the Core Web Vitals.
Foundational Metrics
These metrics are the building blocks of page load performance. A slowness in these early stages will inevitably delay everything that follows.
Time To First Byte (TTFB)
TTFB measures the time from when a user makes a request to when their browser receives the very first byte of the HTML response. It is a fundamental measure of server and network responsiveness.
- Good: Under 800 milliseconds (ms)
- Needs Improvement: 800 ms to 1.8 seconds
- Poor: Over 1.8 seconds
Why it Matters
A slow TTFB creates a bottleneck for every subsequent metric. Optimizing it is the critical first step.
First Contentful Paint (FCP)
FCP marks the point when the browser renders the first piece of content from the DOM (e.g., text, an image, or a logo). It answers the user's initial question: "Is it happening?"
- Good: Under 1.8 seconds
- Needs Improvement: 1.8 to 3.0 seconds
- Poor: Over 3.0 seconds
Why it Matters
A fast FCP provides the first visual feedback that the page is loading, reducing the frustrating blank screen experience and lowering bounce rates.
The Core Web Vitals
As the industry's quasi-standard, Google's Core Web Vitals (CWV) are the most modern set of metrics designed to measure real-world user experience. Because they are direct ranking factors for SEO and can also influence Google Ad prices, they are a critical focus for business success. For a detailed analysis of how performance impacts these outcomes, see our documentation on Speed Kit's Business Impact. However, it is important to note that not all browsers have adopted these metrics, as the table below shows.
Largest Contentful Paint (LCP)
LCP measures when the largest content element (typically a hero image or a large block of text) in the viewport becomes visible. It signals that the main content of the page has loaded, answering the user's question: "Is it useful?".
While the industry has aligned on Google's standard thresholds, our analysis of business impact and cognitive psychology shows that a more granular approach is necessary to achieve a competitive advantage in e-commerce. Simply aiming for Google's "good" baseline is not enough to maximize user engagement and conversion rates.
Google's Standard Thresholds
Google defines three primary buckets for LCP performance, which serve as the industry baseline:
- Good: 2.5 seconds or less
- Needs Improvement: Between 2.5 and 4.0 seconds
- Poor: Over 4.0 seconds
The Speed Kit Standard: High-Resolution LCP
To provide more actionable goals and reflect the true impact of speed, Speed Kit splits Google's "Good" category into three distinct tiers. This high-resolution standard is used across all of our tooling, including our RUM dashboards and reporting, to help you focus on optimizations that deliver a truly superior user experience and drive business success.
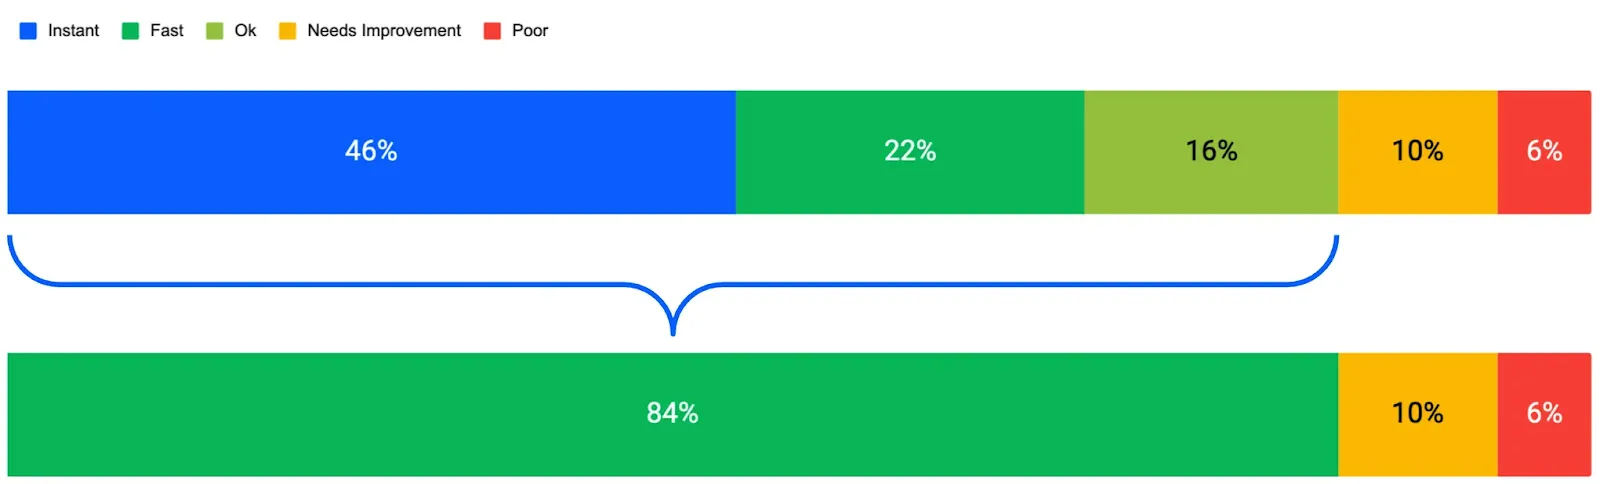
- Instant (< 300 ms): This threshold represents the technical version of instant. It is the tangible goal for a seamless user experience, achievable today using the best available technology: predictive pre-rendering. While cognitive research defines true human instantaneous perception at 100 ms, our sub-300 ms target is based on the pinnacle of what can be delivered in a real-world browser environment.
- Fast (< 1,000 ms): The user remains in a state of flow, and the interface feels highly responsive. This should be the primary target for any e-commerce site looking to keep users engaged.
- OK (< 2,500 ms): This represents the original boundary for Google's "Good" threshold and is the baseline for SEO. Meeting this target is essential to avoid potential ranking penalties, but since it represents a noticeable delay for users, it should be considered table stakes, not a competitive advantage.
- Needs Improvement (< 4,000 ms): Aligns with Google's standard. The user is actively waiting, and frustration is likely.
- Poor (> 4,000 ms): Aligns with Google's standard. High abandonment risk and a significant barrier to business success.
Why These Thresholds Matter
Our extended thresholds are based on three key areas of research:
- Cognitive Psychology: The foundational principles of response time perception originate from Robert B. Miller's 1968 study on mainframe computer interactions, "Response Time in Man-Computer Conversational Transactions". This research was later tested and popularized for the modern web by the Nielsen Norman Group. Their work confirms that 1.0 second is the limit for a user's flow of thought to remain uninterrupted, while interactions under 100 ms feel truly instantaneous. You can read their full analysis in the article, "Response Times: The 3 Important Limits".
- E-commerce Business Impact: Analysis from our RUM data, visualized in our business impact chart, reveals a direct and dramatic correlation between LCP and conversion rates. The financial benefit is not linear; the biggest gains are realized as load times become much faster than the 2.5s baseline. The most significant revenue uplift for e-commerce sites lies in achieving an LCP of under 1.0 second. For a detailed analysis, please refer to our documentation on Speed Kit's Business Impact.
- Technical Achievability: When Google first defined the LCP thresholds, widespread browser support for effective pre-rendering did not exist. However, the recent introduction of technologies like the Speculation Rules API has changed what is possible. Speed Kit's predictive preloading engine leverages these modern capabilities to pre-render pages in the background before a user even clicks. Based on our real-user measurements, this approach makes LCP values between 20 ms and 300 ms technically achievable, making an "Instant" experience a realistic goal today.
Interaction to Next Paint (INP)
INP measures a page's overall responsiveness to user interactions like clicks, taps, and key presses. It calculates the time from the user's action until the next visual update is painted on the screen.
- Good: 200 milliseconds (ms) or less
- Needs Improvement: Between 200 ms and 500 ms
- Poor: Over 500 ms
Why it Matters
A low INP ensures the user interface feels fluid and responsive. A high INP leads to a laggy, frustrating experience, especially on interactive pages like checkouts or forms.
Cumulative Layout Shift (CLS)
CLS quantifies the visual stability of a page by measuring how much visible elements move around unexpectedly during loading.
- Good: A score of 0.1 or less
- Needs Improvement: A score between 0.1 and 0.25
- Poor: A score over 0.25
Why it Matters
A low CLS prevents frustrating experiences where users click on the wrong thing because a button or link shifted at the last second. It is a key indicator of a professional and trustworthy user interface.
From Data to Action: Building a Performance Strategy
Measuring performance is only the first step. The true value comes from using that data to build a sustainable culture of performance that protects user experience and drives business growth.
Set Clear Performance Goals
Before starting any project or optimization effort, establish clear, measurable performance goals. This is the most critical step to avoid costly mistakes.
- Start with Reality: Use your RUM data to understand your current baseline performance.
- Define Your "North Star": Set goals based on the Core Web Vitals (e.g., "75th percentile of users should have an LCP under 2.5 seconds").
- Focus on Key User Journeys: Prioritize the performance of your most critical flows, such as the path from the homepage to a completed purchase.
- Agree on a Source of Truth: The entire team must agree on a single tool (ideally your RUM solution) to be the official source of truth for tracking progress against goals.
Establish Performance Budgets
Performance budgets are technical limits integrated into your development process to prevent regressions. They are your primary defense against the natural tendency for sites to slow down over time as new features are added.
- Budget for User Outcomes: Set budgets on the Core Web Vitals (LCP, INP, CLS), not just on simple metrics like file size. This ensures you are always focused on the actual user experience.
- Automate Enforcement: Integrate budget checks into your CI/CD pipeline. Automatically trigger a warning or block a deployment if a code change violates a performance budget.
- Adopt an Incremental Approach: For existing sites, set an initial budget based on your current performance to prevent things from getting worse. After every successful optimization, tighten the budget to "lock in" the gains.
Correlate Performance with Business KPIs
To make the business case for performance and understand where to invest, you must connect your metrics to financial outcomes.
- Analyze Your RUM Data: Use your RUM solution to segment users and analyze how metrics like LCP and INP affect your conversion rate, average order value, and bounce rate.
- Identify "How Fast is Fast Enough": Determine the performance threshold where you see the biggest gains in business metrics. This helps you prioritize efforts that will have the greatest ROI. For many e-commerce sites, our data shows that a load time under 1 second correlates with the highest conversion rates.
- Justify Investment: Use this data to demonstrate to stakeholders that investing in performance is not a cost center but a direct driver of revenue and profitability.
Measuring Performance in Single-Page Applications (SPAs)
Single-Page Applications (SPAs) offer fluid, app-like user experiences by dynamically rewriting content instead of performing full page reloads. However, this modern architecture introduces significant challenges for performance measurement that business and technical owners are often unaware of. Standard performance tools were designed for traditional multi-page websites, and as a result, they often fail to capture the true user experience within an SPA.
The Measurement Blind Spot
The fundamental problem is that for many analytics and RUM tools, only the initial page load is measured accurately. When a user performs a "soft navigation" (clicking a link that loads a new view without a full page reload), the Core Web Vitals are often not re-measured. This creates a massive blind spot where significant portions of the user journey are untracked, leading to a distorted view of actual performance.
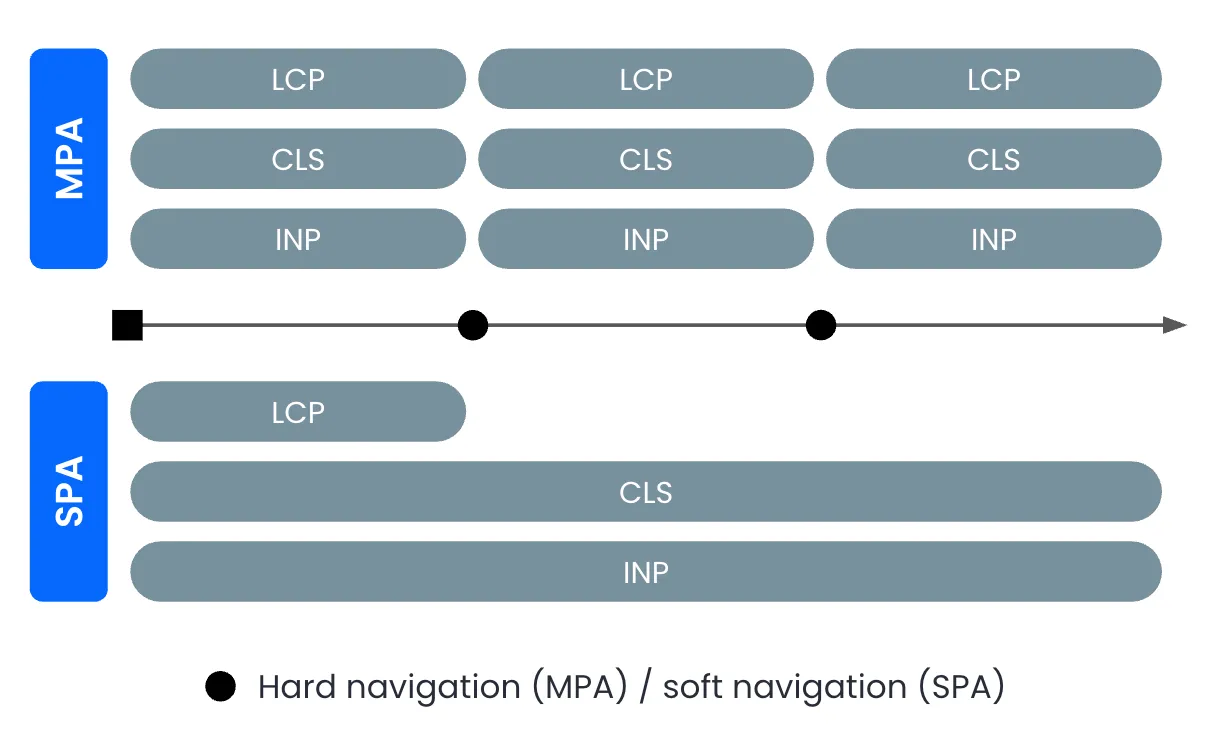
- Largest Contentful Paint (LCP): Standard LCP is only measured for the initial, "hard" navigation. It completely misses the load time for the main content of subsequent views that appear after a soft navigation, which is a critical perceived performance metric for the user.
- Interaction to Next Paint (INP) & Cumulative Layout Shift (CLS): While these metrics continue to be measured throughout the user's session, any issues that occur after a soft navigation are incorrectly attributed back to the initial page load. This makes it extremely difficult to identify which specific component or user interaction caused a slow response or a layout shift deep within the application.
The Solution: SPA-Aware Real User Monitoring
Accurately measuring the user experience in Single-Page Applications is a well-known industry challenge. While Google is developing a standardized approach for soft navigations, it is not expected to be released until early 2026.
To bridge this measurement gap today, Speed Kit offers a dedicated solution to track the most critical aspects of SPA performance. Our Real User Monitoring (RUM) has been enhanced to specifically measure the Largest Contentful Paint (LCP) for soft navigations. This provides an authentic picture of the perceived load speed when users navigate between views within your application. This ensures that significant performance issues can be identified and optimized now, without waiting for future browser updates.
For a detailed technical explanation of this feature, please refer to our blog post: Measuring Largest Contentful Paint in Single-Page Applications.