How E-Wheels increased conversions by +2.27% with Speed Kit
- Micromobility Retail
- Norway
- Optimizely
+2.27%
Relative uplift in user conversion rate
−484 ms
LCP improvement on enabled pages
67%
Traffic loads within 1 s
Introduction
E-Wheels sells e-bikes and e-scooters online across six markets. The Norwegian retailer has been at it since 2014, has grown to seven stores alongside the shop, and has served more than 350,000 customers.
Challenge
E-Wheels does not build its own storefront. Partners handle the development, and performance was steered the way most teams steer it: run a Lighthouse report, look at the score, hand the details to the developers.
That leaves a blind spot. A lab score says what a test browser measured once, not what a customer on a phone in Bergen actually waited for. And E-Wheels was not a slow shop, which makes the blind spot harder rather than easier: without real user data there was nothing obvious to point at, and no way to tell whether fixing it would be worth anything.
Solution
Speed Kit went in as a JavaScript snippet, tested on the pre-production environment first and then rolled out in stages. Nothing changed in the Optimizely platform underneath, and the client-side A/B testing E-Wheels already ran kept working.
From there Speed Kit predicts which page a shopper will open next and prepares it before the click. On E-Wheels it predicts unusually well: 83% of onward navigations were ready before they were asked for, and more than half of those were fully rendered in the background - one of the highest rates Speed Kit has measured.
Speed Kit then ran as a 50/50 PoC phase against an unaccelerated control group, so every figure below comes from E-Wheels' own shoppers, measured side by side.
Results
Predictive Preloading Coverage
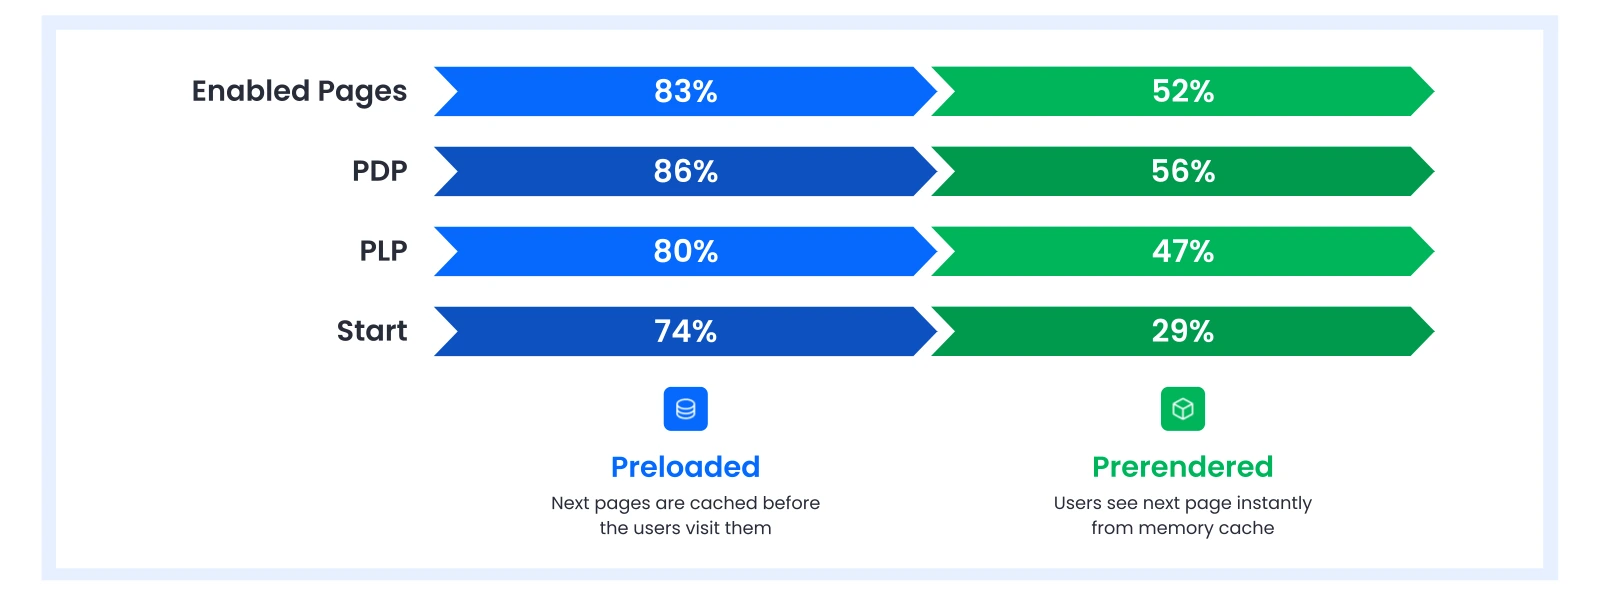
Coverage is highest exactly where shoppers spend their time. On product pages, where an e-bike is compared spec by spec, 86% of next pages were preloaded and 56% arrived instantly from memory.
Performance Improvements - Largest Contentful Paint (LCP)
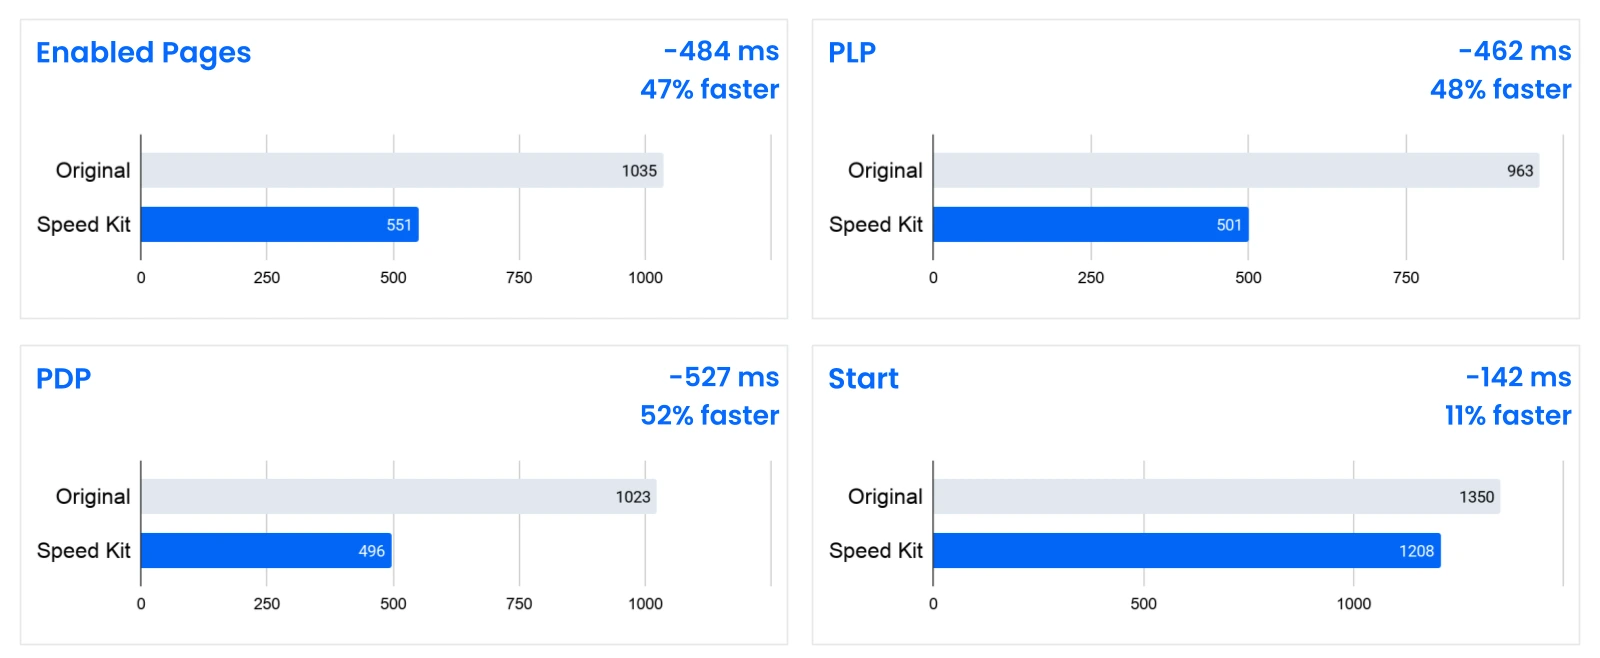
Speed Kit cut the median Largest Contentful Paint by 484 ms, roughly halving it, and Time to First Byte by 229 ms. The share of traffic loading within one second rose from 48% to 67%, and the number of shoppers seeing a page in under 300 ms nearly tripled.
Business Impact - PoC Phase: Conversion Rate Analysis
Both groups saw the same shop, the same products and the same prices. The only difference was how quickly the pages appeared.
| Metric | Relative uplift |
|---|---|
| User conversion rate | +2.27% |
| Revenue per visitor | +4.22% |
| Average order value | +2.03% |
Conclusion
E-Wheels traded a lab score for a measurement on its own shoppers, and got a faster shop out of it without changing how that shop is built. Extending the acceleration to the other five markets is a matter of days, because they run on the same infrastructure.